
F3.large
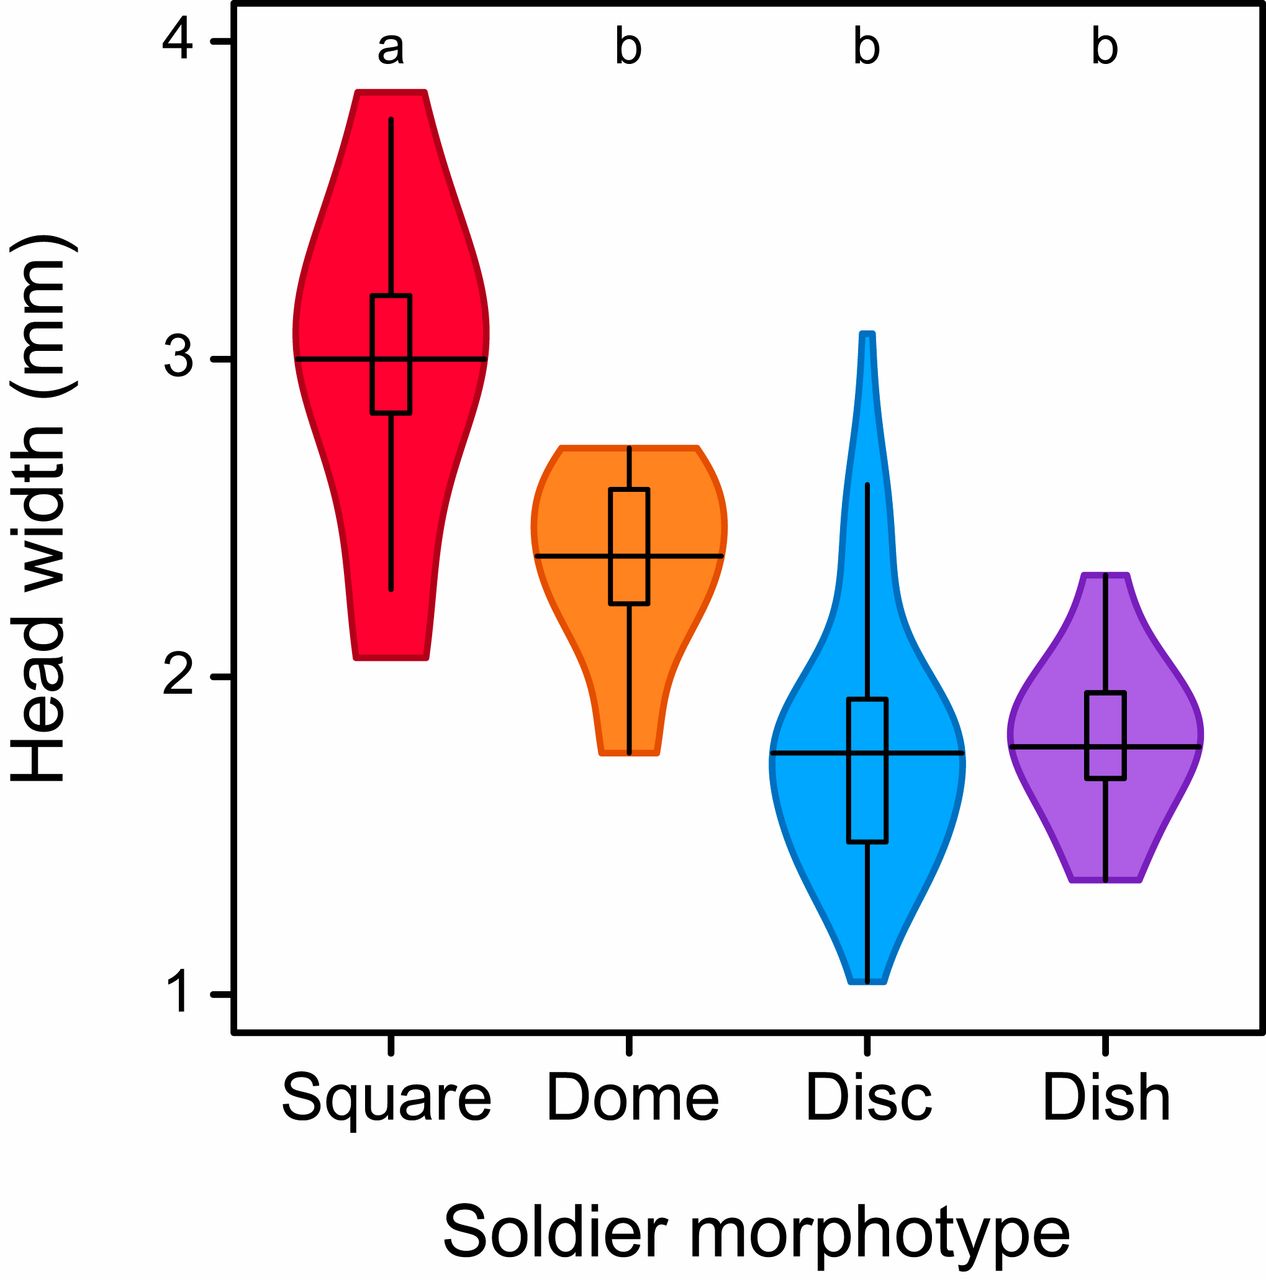
Fig. 3.
Violin plots showing soldier head width distributions for the species representing each of the four soldier morphotypes in the turtle ants. Lowercase letters denote significantly different means between morphotypes after accounting for the phylogenetic relationships among species (PGLS; P ≤ 0.05). Each plot incorporates a kernel density plot of the data and a boxplot with a box encompassing the interquartile range (IQR), a line drawn at the median, and the whiskers extending to the upper and lower quartiles (±1.5 times the IQR). Plots were created with the R package vioplot (67).
Leave a Reply