
F2.large
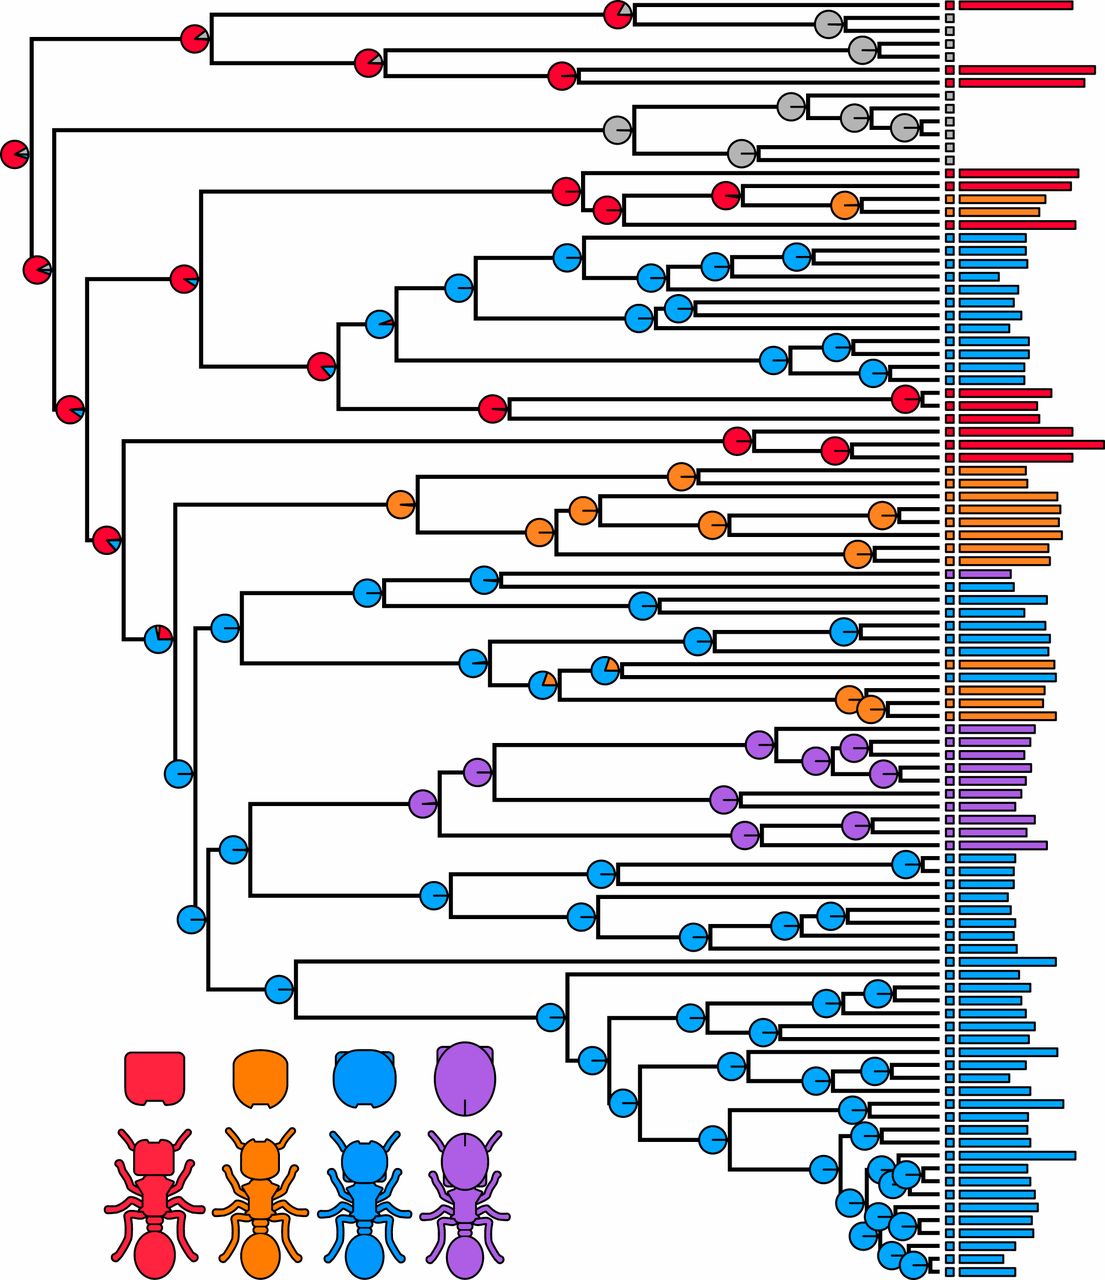
Fig. 2.
The evolution of soldier morphotypes in the turtle ants, incorporating head width data for extant species. Soldier morphotype is color-coded as illustrated in the Inset (bottom left; red for square-headed morphotype, orange for dome, blue for disc, and purple for dish). Gray denotes the absence of a soldier caste. Pie charts show the maximum likelihood estimates for ancestral morphotype states at the nodes, under the best-fitting equal rates model. Squares at the tips show the morphotypes (colored) or the absence (gray) of a soldier caste in extant species. The variable length bars at the tips are color-coded by morphotype and scaled by head width for those extant species with a soldier. The phylogeny is the maximum clade credibility tree from Price et al. (36) that has been trimmed to include only species for which soldier data are available. Species names and previously defined species groups are given in SI Appendix, Fig. S3.
Leave a Reply